“Daily Data” Videos Make All Information Into Beautiful Art (25 Videos)
We’ve told you before that data is beautiful. But have we told you lately that charts and graphs in video form are even more beautiful? Well, it’s true. @Data_visual on TikTok has the charts you’ve been looking for, and they’re eye-opening. Daily Data posts a video a day showing you all kinds of information that puts numbers into perspective.
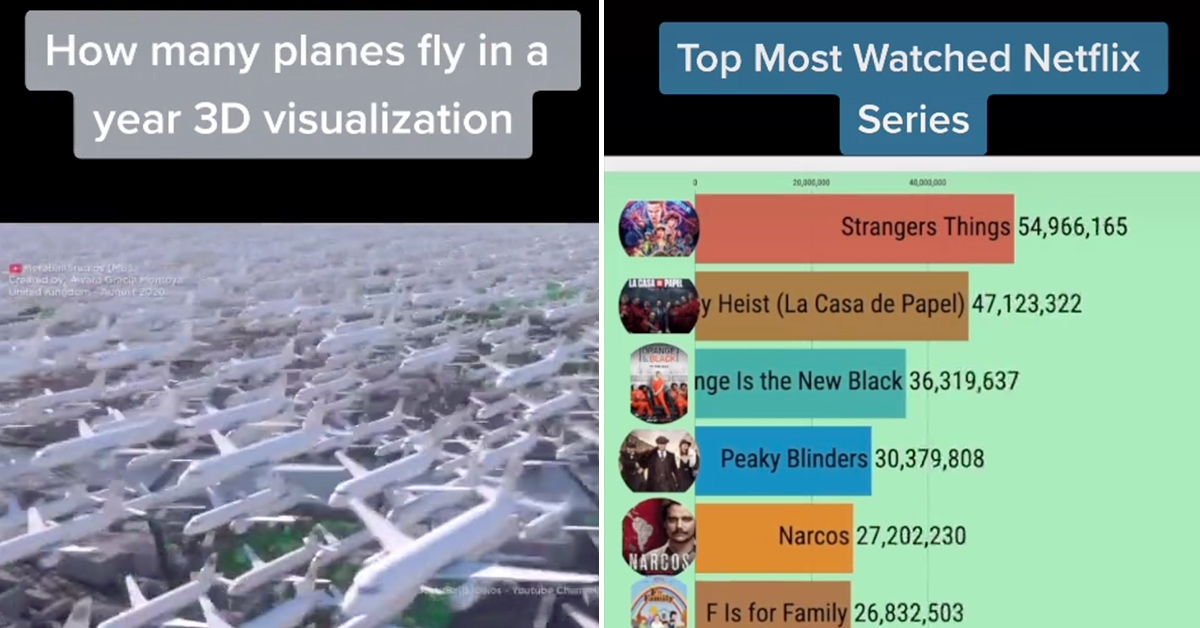
Whether you want to know how many flights take off and land per year or how many people watch the same Netflix series you do, all of it will eventually be covered by this TikTok account.
Videos are way more fun than reading. I hope you feel smarter after watching these.
Data is even more beautiful when it’s made in video form and @Data_visual on TikTok is the proof:
1. Human deaths in wars throughout history.
@data_visual#war #deaths #fy #visualdata #viral♬ original sound – Rowen
2. Oil consumption by country
@data_visual##fy ##fyp ##dailydata ##petroleum♬ оригинальный звук – krs050200
3. COVID vs. other causes of death.
@data_visual##fy ##fyp ##covid ##viral♬ Song of the Vikings (My Mother Told Me) – Perły i Łotry
4. Most populous countries.
@data_visual##fy ##fyp ##population ##statistics♬ stan – favsoundds
5. Number of international students studying in the USA.
@data_visual##fy ##fyp ##students ##usa♬ Only Time – Roisin
6. Most popular streaming service over the last few years.
@data_visual##foryou ##fyp ##stream ##service♬ Somebody That I Used To Know – Gotye;Kimbra
7. Flights per year.
@data_visual##foryou ##fyp ##plane ##year♬ original sound – Rowen
8.YouTube most viewed videos.
@data_visual##fy♬ I Like It Like That – Estudio KL
9. Life expectancy.
@data_visual##foryou ##life ##expectency ##fy♬ I went viral – I simp for Scott 😍👊🏻
10. Internet users by country over time.
@data_visual##fy ##fyp ##internet ##country♬ Somebody That I Used To Know (feat. Kimbra) – Gotye – ur other mother